
Akuniya Agwandas

AKUNIYA AGWANDAS

Data Analyst | IT Specialist | Developer

About Me

I'm a dedicated data analyst with expertise in turning complex data into actionable insights. With a background in Computer Engineering, I specialize in data visualization, statistical analysis, and developing machine learning models to solve real-world problems.

Alongside data anaysis, i have experience in other fields such as Networking, software development and so on.

My passions lies in Internet of Things, innovative and upcoming technology, and I'm constantly expanding my skillset to stay at the forefront of data analysis techniques and overall technology advancements.

Skills

Programming Languages

Python C++ R SQL JavaScript noSQL

Data Analysis

Pandas NumPy SciPy Statistical Analysis Data Cleaning

Data Visualization

Matplotlib Seaborn Plotly Tableau Power BI GRAFANA

Machine Learning

Scikit-Learn TensorFlow PyTorch Regression Classification Clustering

Database Systems

MySQL Microsoft EXCEL Google WorkspaceL NOTION

Tools & Technologies

Git Jupyter Docker AWS

Projects

Data Visualization Project

Sales Data Analysis & Visualization

Analyzed sales data from a retail company to identify trends and provide actionable insights that led to a 15% increase in quarterly revenue.

Python Pandas Matplotlib Tableau
Machine Learning Project

Electric System Fault Prediction Model

Developed a machine learning model that predicts electrical faults with 87% accuracy, helping technicians at power stations identify faults and implement proactive maintenance.

Python Scikit-Learn TensorFlow Random forest Feature Engineering
Smart Grid Monitoring Project

Electric System Smart Monitoring System

Monitoring system for electrical systems to access data and parameters online.
Python IoT Raspberry Pi AWS IoT Real-time Data
Dashboard

Electric System Data Dashboard

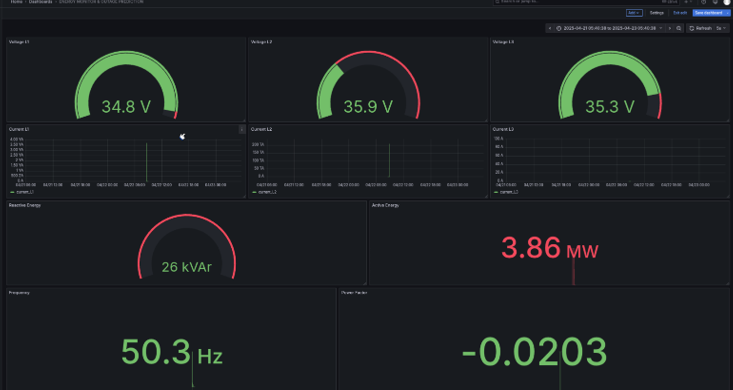
This dashboard visualizing electrical parameters across different substations, allowing users to explore trends and compare statistics.
Python Dash Plotly Pandas Grafana
Moisture and Gas leakage detection system

Moisture and Gas Leakage Detection System

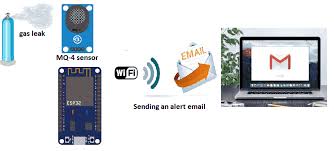
This is a security system that alerts via phone notification and Email when a gas or water leak is detected

It implements IoT using sensors that trigger the alerts and safety lights when gas and moisture levels rise above threshold

Node MCU Arduino IDE MQ2 Gas Sensor Rain Drop Sensor Blynk

Sales Data Analysis & Visualization

Sales Data Visualization Image

Project Overview

This project involved analyzing sales data from a major retail company to identify trends, patterns, and areas for improvement. Using Python for data processing and Tableau for visualization, I delivered actionable insights that led to a 15% increase in quarterly revenue.

Challenge

The retail company had 3 years of sales data across multiple stores nationwide but struggled to understand seasonal trends, product performance, and customer demographics. They needed clear visualizations and recommendations to optimize their inventory and marketing strategies.

Solution

I developed a comprehensive analysis pipeline that included:

  • Data cleaning and preprocessing using Python and Pandas
  • Exploratory data analysis to identify patterns and anomalies
  • Statistical testing to validate hypotheses about product performance
  • Interactive Tableau dashboards for executives to explore the data

Key Findings

  • Identified specific product categories with 40% higher sales during holiday seasons
  • Discovered regional preferences that informed targeted marketing campaigns
  • Found optimal price points for maximizing revenue on key products
  • Detected underperforming stores and recommended specific improvements

Technologies Used

Python Pandas NumPy Matplotlib Seaborn Tableau SQL

Electric System Fault Prediction Model

Fault Prediction Model Image

Project Overview

For this project, I developed a machine learning model to predict electrical faults for power stations. The model achieved 87% accuracy in identifying potential faults, allowing for proactive maintenance and reducing downtime.

Challenge

Power stations were experiencing unexpected equipment failures leading to costly downtime and repair expenses. The challenge was to develop a predictive system that could analyze sensor data and identify potential failures before they occurred.

Solution

I built a comprehensive fault prediction system that included:

  • Feature engineering from time-series sensor data
  • Testing multiple machine learning algorithms (Random Forest, XGBoost, Neural Networks)
  • Hyperparameter tuning to optimize model performance
  • Development of an automated alerting system for maintenance teams

Results

  • 87% accuracy in predicting electrical faults up to 48 hours in advance
  • Identified the top 5 factors leading to system failures
  • Reduced unplanned downtime by 23% in the first quarter after implementation
  • Created a real-time monitoring dashboard for operations teams

Technologies Used

Python Scikit-Learn TensorFlow Random Forest Feature Engineering Pandas Matplotlib

Electric System Smart Monitoring System

Smart Grid Monitoring System Image

Project Overview

This project involved creating a smart monitoring system for electrical grids that enables online access to real-time data and parameters. This system allows remote monitoring of critical electrical infrastructure and facilitates timely interventions.

Challenge

Traditional electrical monitoring systems required physical presence at substations for readings and diagnostics. The goal was to create a system that allowed remote access and real-time monitoring of critical parameters to improve maintenance efficiency and reduce response times.

Solution

I developed an IoT-based smart monitoring system with the following components:

  • Sensor network deployment at key points in the electrical grid
  • Secure data transmission and cloud storage architecture
  • Real-time analytics and threshold-based alerting system
  • Web-based dashboard for remote monitoring access
  • Mobile application for on-the-go monitoring and alerts

Key Features

  • Real-time monitoring of voltage, current, power factor, and frequency
  • Automated alerts for abnormal conditions or potential failures
  • Historical data analysis and trend visualization
  • Remote control capabilities for specific system parameters

Technologies Used

Python IoT Sensors Raspberry Pi MQTT Protocol AWS IoT Flask React

Electric System Data Dashboard

Electric System Dashboard

Project Overview

This project involved creating an interactive dashboard to visualize electrical parameters across different substations. The dashboard allows users to explore trends, compare statistics, and understand the performance of the electrical system.

Challenge

There was a large amount of electrical data being collected, but limited tools for non-technical users to easily visualize and understand the information. The goal was to create an accessible, user-friendly dashboard for visualization and analysis.

Solution

I developed an interactive dashboard using Python's Dash framework and Grafana with the following components:

  • Automated data pipeline to collect and clean electrical parameters
  • Interactive visualizations showing key performance indicators
  • Time-series analysis with customizable date ranges
  • Comparative tools to analyze multiple substations simultaneously
  • Alert system for parameters exceeding normal ranges

Key Features

  • Real-time data updates from substation sensors
  • Mobile-responsive design for access on any device
  • Customizable views based on user preferences
  • Export functionality for reports and presentations

Technologies Used

Python Dash Plotly Pandas Grafana PostgreSQL

Work Experience

Data Analyst

Nile university | January 2025 - Present

  • Led a team of analysts in developing dashboards that increased decision-making efficiency by 25%
  • Automated reporting processes, saving 15 hours weekly and improving data accuracy

IT specialist intern

NNPC gas marketing Limited | March 2024 - August 2024

  • assisting with various IT tasks, including troubleshooting, providing technical support, and learning about different aspects of IT operations, such as hardware, software, and network infrastructure.
  • Created interactive visualizations for executive presentations
  • Collaborated with cross-functional teams to implement data-driven solutions

Education

Bachelors of Computer Engineering

Nile University of Nigeria | 2020 - 2025

Relevant coursework: Machine Learning, Statistical Analysis, Internet of Things, Embedded systems, Image processing, Neural Networks

Graduated with honors.

Networking Officer

CISCO Networking Academy | 2023 - 2024

extensive comprehension of networking, both soft ware and hardware. network security and networking set up and trouble shooting

Contact Me

Feel free to reach out if you'd like to collaborate on a project or discuss opportunities!

Email

niyagwandas@gmail.com

Phone

08138415720

Location

FCT, Nigeria